| 0 | 1 | 2 | 3 | 4 | 5 | 6 | 7 | 8 | |
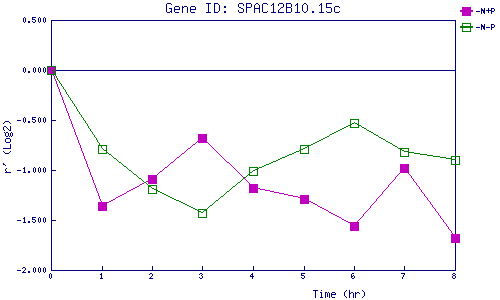
| -N+P | 0.000 | -1.359 | -1.092 | -0.676 | -1.181 | -1.286 | -1.565 | -0.984 | -1.683 |
| -N-P | 0.000 | -0.793 | -1.192 | -1.433 | -1.011 | -0.790 | -0.530 | -0.820 | -0.895 |
|
-N+P: Nitrogen starved in the presence of P-factor -N-P: Nitrogen starved in the absence of P-factor |