hsp60 mcp60
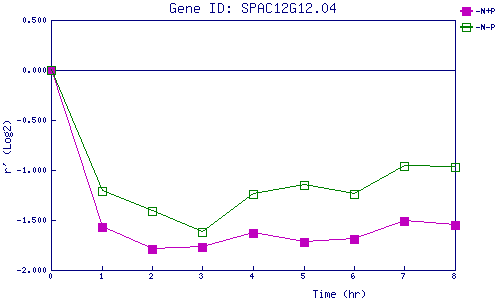
| 0 | 1 | 2 | 3 | 4 | 5 | 6 | 7 | 8 | |
| -N+P | 0.000 | -1.571 | -1.787 | -1.766 | -1.626 | -1.722 | -1.688 | -1.506 | -1.549 |
| -N-P | 0.000 | -1.207 | -1.413 | -1.625 | -1.239 | -1.148 | -1.240 | -0.960 | -0.969 |
|
-N+P: Nitrogen starved in the presence of P-factor -N-P: Nitrogen starved in the absence of P-factor |