snr52
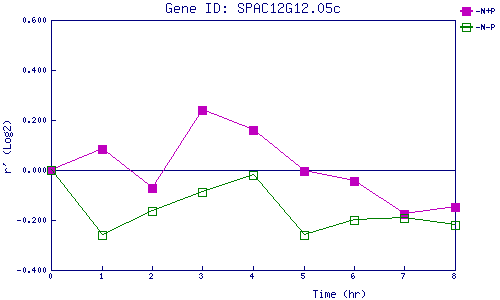
| 0 | 1 | 2 | 3 | 4 | 5 | 6 | 7 | 8 | |
| -N+P | 0.000 | 0.085 | -0.073 | 0.238 | 0.162 | -0.004 | -0.043 | -0.178 | -0.148 |
| -N-P | 0.000 | -0.259 | -0.164 | -0.088 | -0.021 | -0.261 | -0.199 | -0.192 | -0.221 |
|
-N+P: Nitrogen starved in the presence of P-factor -N-P: Nitrogen starved in the absence of P-factor |