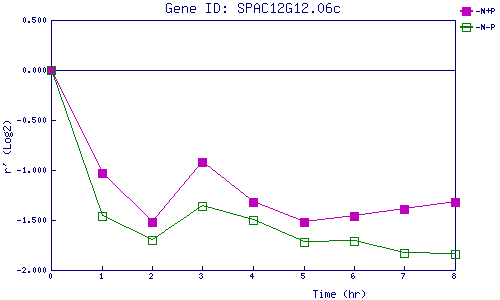
| 0 | 1 | 2 | 3 | 4 | 5 | 6 | 7 | 8 | |
| -N+P | 0.000 | -1.029 | -1.517 | -0.922 | -1.324 | -1.520 | -1.455 | -1.392 | -1.324 |
| -N-P | 0.000 | -1.455 | -1.704 | -1.357 | -1.496 | -1.723 | -1.708 | -1.829 | -1.835 |
|
-N+P: Nitrogen starved in the presence of P-factor -N-P: Nitrogen starved in the absence of P-factor |