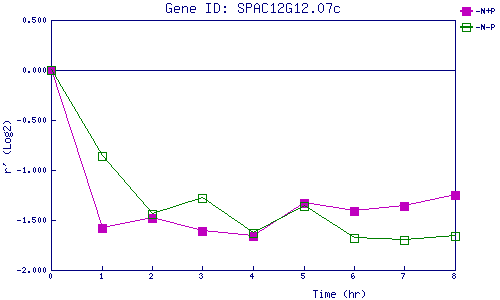
| 0 | 1 | 2 | 3 | 4 | 5 | 6 | 7 | 8 | |
| -N+P | 0.000 | -1.579 | -1.479 | -1.613 | -1.663 | -1.330 | -1.413 | -1.360 | -1.248 |
| -N-P | 0.000 | -0.862 | -1.445 | -1.277 | -1.626 | -1.355 | -1.675 | -1.696 | -1.655 |
|
-N+P: Nitrogen starved in the presence of P-factor -N-P: Nitrogen starved in the absence of P-factor |