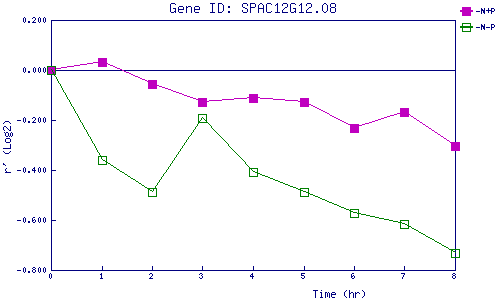
| 0 | 1 | 2 | 3 | 4 | 5 | 6 | 7 | 8 | |
| -N+P | 0.000 | 0.032 | -0.055 | -0.130 | -0.114 | -0.130 | -0.230 | -0.170 | -0.305 |
| -N-P | 0.000 | -0.359 | -0.489 | -0.190 | -0.409 | -0.488 | -0.573 | -0.615 | -0.731 |
|
-N+P: Nitrogen starved in the presence of P-factor -N-P: Nitrogen starved in the absence of P-factor |