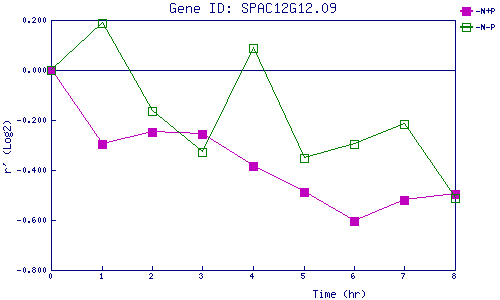
| 0 | 1 | 2 | 3 | 4 | 5 | 6 | 7 | 8 | |
| -N+P | 0.000 | -0.295 | -0.247 | -0.258 | -0.384 | -0.487 | -0.605 | -0.522 | -0.496 |
| -N-P | 0.000 | 0.187 | -0.163 | -0.330 | 0.086 | -0.351 | -0.298 | -0.215 | -0.511 |
|
-N+P: Nitrogen starved in the presence of P-factor -N-P: Nitrogen starved in the absence of P-factor |