| 0 | 1 | 2 | 3 | 4 | 5 | 6 | 7 | 8 | |
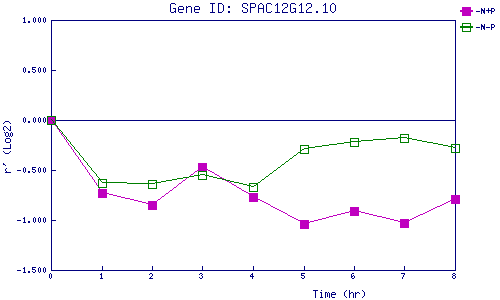
| -N+P | 0.000 | -0.727 | -0.848 | -0.471 | -0.772 | -1.036 | -0.913 | -1.033 | -0.794 |
| -N-P | 0.000 | -0.629 | -0.640 | -0.549 | -0.672 | -0.287 | -0.224 | -0.180 | -0.281 |
|
-N+P: Nitrogen starved in the presence of P-factor -N-P: Nitrogen starved in the absence of P-factor |