cid14
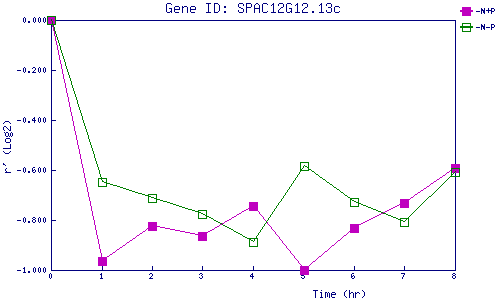
| 0 | 1 | 2 | 3 | 4 | 5 | 6 | 7 | 8 | |
| -N+P | 0.000 | -0.964 | -0.825 | -0.866 | -0.745 | -0.998 | -0.834 | -0.732 | -0.593 |
| -N-P | 0.000 | -0.646 | -0.710 | -0.777 | -0.889 | -0.585 | -0.729 | -0.809 | -0.608 |
|
-N+P: Nitrogen starved in the presence of P-factor -N-P: Nitrogen starved in the absence of P-factor |