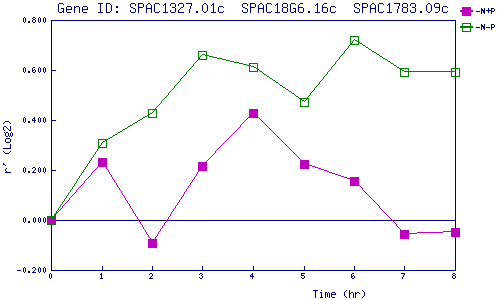
| 0 | 1 | 2 | 3 | 4 | 5 | 6 | 7 | 8 | |
| -N+P | 0.000 | 0.231 | -0.092 | 0.218 | 0.429 | 0.222 | 0.157 | -0.057 | -0.047 |
| -N-P | 0.000 | 0.309 | 0.428 | 0.661 | 0.612 | 0.471 | 0.720 | 0.594 | 0.590 |
|
-N+P: Nitrogen starved in the presence of P-factor -N-P: Nitrogen starved in the absence of P-factor |
Return to Microarray Home