cyp51
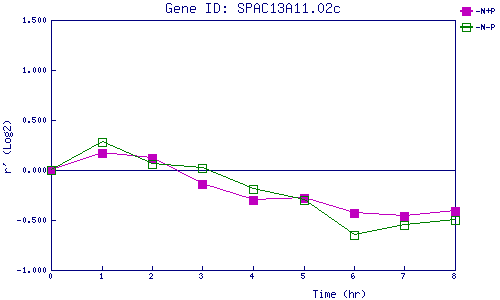
| 0 | 1 | 2 | 3 | 4 | 5 | 6 | 7 | 8 | |
| -N+P | 0.000 | 0.166 | 0.120 | -0.138 | -0.304 | -0.278 | -0.426 | -0.455 | -0.412 |
| -N-P | 0.000 | 0.279 | 0.063 | 0.019 | -0.187 | -0.304 | -0.648 | -0.554 | -0.497 |
|
-N+P: Nitrogen starved in the presence of P-factor -N-P: Nitrogen starved in the absence of P-factor |