reserved_name_ubp8
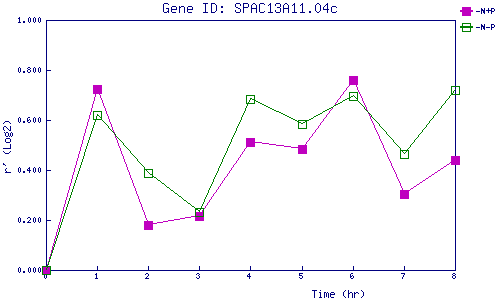
| 0 | 1 | 2 | 3 | 4 | 5 | 6 | 7 | 8 | |
| -N+P | 0.000 | 0.723 | 0.180 | 0.218 | 0.510 | 0.485 | 0.759 | 0.305 | 0.442 |
| -N-P | 0.000 | 0.619 | 0.389 | 0.230 | 0.684 | 0.584 | 0.697 | 0.464 | 0.718 |
|
-N+P: Nitrogen starved in the presence of P-factor -N-P: Nitrogen starved in the absence of P-factor |