hgp1
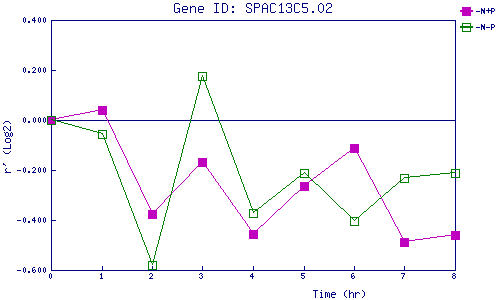
| 0 | 1 | 2 | 3 | 4 | 5 | 6 | 7 | 8 | |
| -N+P | 0.000 | 0.042 | -0.378 | -0.167 | -0.456 | -0.265 | -0.110 | -0.486 | -0.460 |
| -N-P | 0.000 | -0.056 | -0.579 | 0.174 | -0.373 | -0.211 | -0.404 | -0.234 | -0.211 |
|
-N+P: Nitrogen starved in the presence of P-factor -N-P: Nitrogen starved in the absence of P-factor |