Sp-snR40-sno
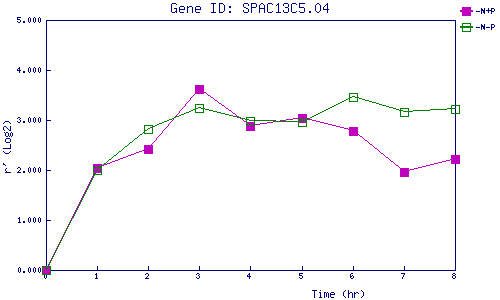
| 0 | 1 | 2 | 3 | 4 | 5 | 6 | 7 | 8 | |
| -N+P | 0.000 | 2.033 | 2.417 | 3.626 | 2.876 | 3.043 | 2.789 | 1.958 | 2.224 |
| -N-P | 0.000 | 1.998 | 2.825 | 3.246 | 2.977 | 2.963 | 3.460 | 3.157 | 3.213 |
|
-N+P: Nitrogen starved in the presence of P-factor -N-P: Nitrogen starved in the absence of P-factor |