rad32
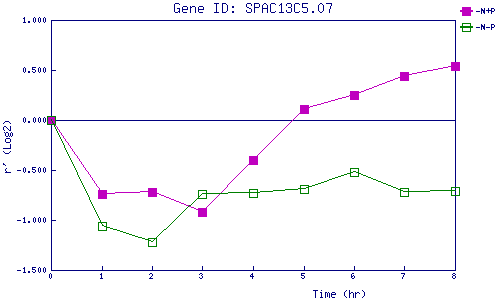
| 0 | 1 | 2 | 3 | 4 | 5 | 6 | 7 | 8 | |
| -N+P | 0.000 | -0.737 | -0.723 | -0.922 | -0.400 | 0.114 | 0.252 | 0.438 | 0.543 |
| -N-P | 0.000 | -1.059 | -1.217 | -0.743 | -0.727 | -0.688 | -0.515 | -0.718 | -0.711 |
|
-N+P: Nitrogen starved in the presence of P-factor -N-P: Nitrogen starved in the absence of P-factor |