byr3 SPATRNAGLY.02
| 0 | 1 | 2 | 3 | 4 | 5 | 6 | 7 | 8 | |
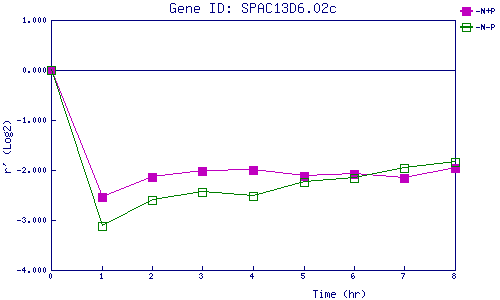
| -N+P | 0.000 | -2.541 | -2.131 | -2.020 | -1.995 | -2.125 | -2.072 | -2.154 | -1.956 |
| -N-P | 0.000 | -3.111 | -2.610 | -2.433 | -2.519 | -2.246 | -2.161 | -1.955 | -1.848 |
|
-N+P: Nitrogen starved in the presence of P-factor -N-P: Nitrogen starved in the absence of P-factor |