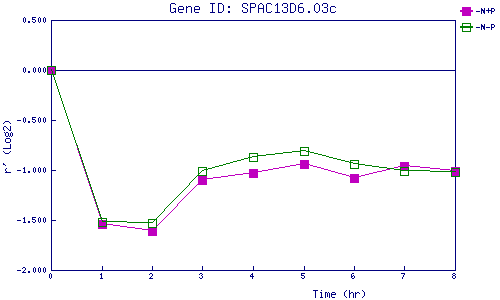
| 0 | 1 | 2 | 3 | 4 | 5 | 6 | 7 | 8 | |
| -N+P | 0.000 | -1.540 | -1.609 | -1.101 | -1.026 | -0.944 | -1.075 | -0.962 | -1.013 |
| -N-P | 0.000 | -1.516 | -1.527 | -1.008 | -0.866 | -0.808 | -0.937 | -1.012 | -1.023 |
|
-N+P: Nitrogen starved in the presence of P-factor -N-P: Nitrogen starved in the absence of P-factor |