msh1
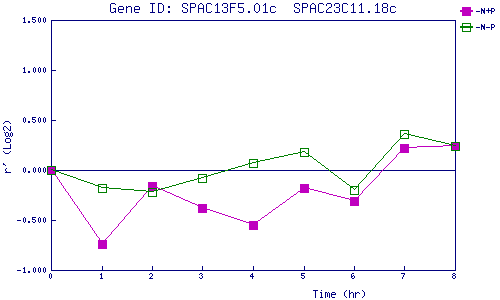
| 0 | 1 | 2 | 3 | 4 | 5 | 6 | 7 | 8 | |
| -N+P | 0.000 | -0.738 | -0.157 | -0.380 | -0.552 | -0.177 | -0.311 | 0.218 | 0.242 |
| -N-P | 0.000 | -0.184 | -0.216 | -0.080 | 0.074 | 0.180 | -0.195 | 0.361 | 0.238 |
|
-N+P: Nitrogen starved in the presence of P-factor -N-P: Nitrogen starved in the absence of P-factor |