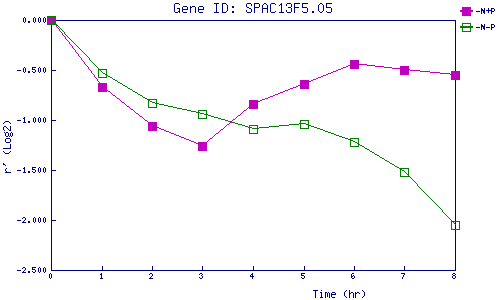
| 0 | 1 | 2 | 3 | 4 | 5 | 6 | 7 | 8 | |
| -N+P | 0.000 | -0.667 | -1.060 | -1.258 | -0.836 | -0.637 | -0.438 | -0.503 | -0.549 |
| -N-P | 0.000 | -0.527 | -0.831 | -0.944 | -1.094 | -1.039 | -1.216 | -1.515 | -2.051 |
|
-N+P: Nitrogen starved in the presence of P-factor -N-P: Nitrogen starved in the absence of P-factor |