rps1-1 rps101 rps3a-1
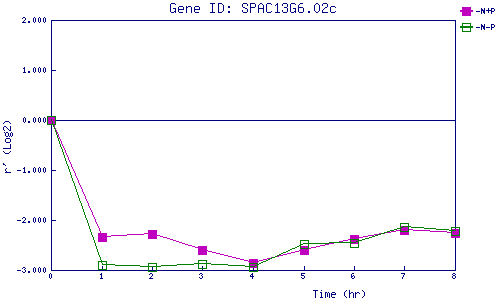
| 0 | 1 | 2 | 3 | 4 | 5 | 6 | 7 | 8 | |
| -N+P | 0.000 | -2.349 | -2.273 | -2.596 | -2.869 | -2.610 | -2.389 | -2.208 | -2.260 |
| -N-P | 0.000 | -2.909 | -2.948 | -2.872 | -2.931 | -2.473 | -2.468 | -2.134 | -2.222 |
|
-N+P: Nitrogen starved in the presence of P-factor -N-P: Nitrogen starved in the absence of P-factor |