tim8
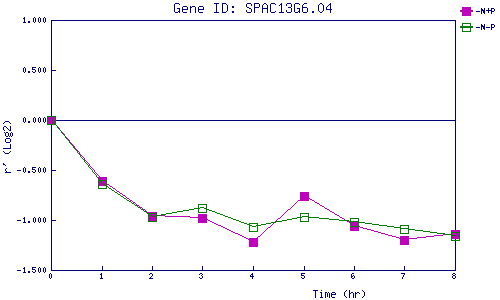
| 0 | 1 | 2 | 3 | 4 | 5 | 6 | 7 | 8 | |
| -N+P | 0.000 | -0.606 | -0.957 | -0.976 | -1.215 | -0.765 | -1.055 | -1.195 | -1.138 |
| -N-P | 0.000 | -0.644 | -0.968 | -0.880 | -1.073 | -0.969 | -1.017 | -1.087 | -1.159 |
|
-N+P: Nitrogen starved in the presence of P-factor -N-P: Nitrogen starved in the absence of P-factor |