rps6-1 rps601
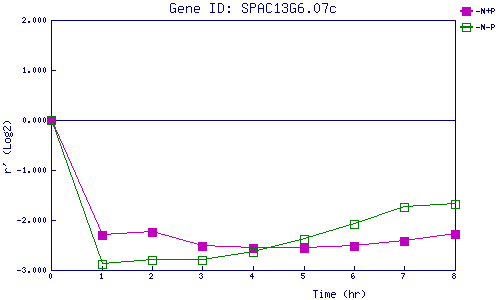
| 0 | 1 | 2 | 3 | 4 | 5 | 6 | 7 | 8 | |
| -N+P | 0.000 | -2.294 | -2.240 | -2.514 | -2.565 | -2.557 | -2.530 | -2.426 | -2.288 |
| -N-P | 0.000 | -2.874 | -2.808 | -2.794 | -2.641 | -2.388 | -2.073 | -1.748 | -1.678 |
|
-N+P: Nitrogen starved in the presence of P-factor -N-P: Nitrogen starved in the absence of P-factor |