| 0 | 1 | 2 | 3 | 4 | 5 | 6 | 7 | 8 | |
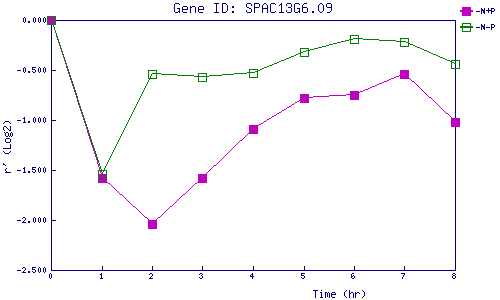
| -N+P | 0.000 | -1.586 | -2.044 | -1.576 | -1.091 | -0.783 | -0.748 | -0.541 | -1.017 |
| -N-P | 0.000 | -1.541 | -0.544 | -0.569 | -0.532 | -0.324 | -0.188 | -0.215 | -0.444 |
|
-N+P: Nitrogen starved in the presence of P-factor -N-P: Nitrogen starved in the absence of P-factor |