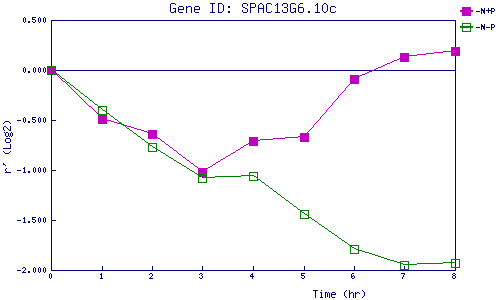
| 0 | 1 | 2 | 3 | 4 | 5 | 6 | 7 | 8 | |
| -N+P | 0.000 | -0.492 | -0.643 | -1.025 | -0.714 | -0.671 | -0.090 | 0.127 | 0.187 |
| -N-P | 0.000 | -0.403 | -0.769 | -1.078 | -1.060 | -1.440 | -1.794 | -1.946 | -1.930 |
|
-N+P: Nitrogen starved in the presence of P-factor -N-P: Nitrogen starved in the absence of P-factor |