| 0 | 1 | 2 | 3 | 4 | 5 | 6 | 7 | 8 | |
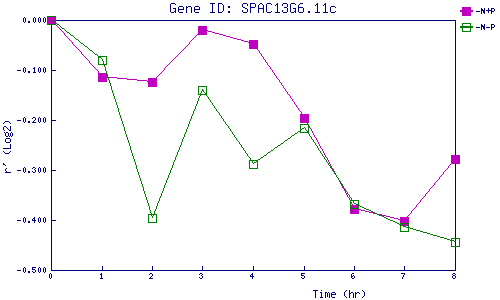
| -N+P | 0.000 | -0.114 | -0.125 | -0.021 | -0.048 | -0.196 | -0.378 | -0.402 | -0.278 |
| -N-P | 0.000 | -0.079 | -0.396 | -0.141 | -0.288 | -0.216 | -0.367 | -0.414 | -0.445 |
|
-N+P: Nitrogen starved in the presence of P-factor -N-P: Nitrogen starved in the absence of P-factor |