erg7
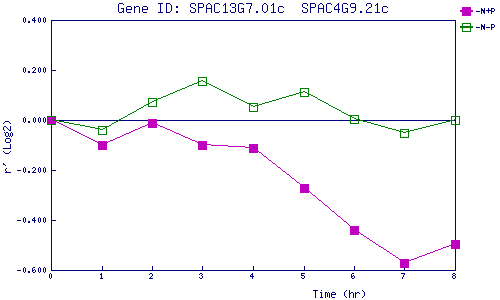
| 0 | 1 | 2 | 3 | 4 | 5 | 6 | 7 | 8 | |
| -N+P | 0.000 | -0.100 | -0.011 | -0.101 | -0.113 | -0.272 | -0.439 | -0.573 | -0.495 |
| -N-P | 0.000 | -0.041 | 0.071 | 0.156 | 0.051 | 0.111 | 0.004 | -0.052 | -0.002 |
|
-N+P: Nitrogen starved in the presence of P-factor -N-P: Nitrogen starved in the absence of P-factor |