| 0 | 1 | 2 | 3 | 4 | 5 | 6 | 7 | 8 | |
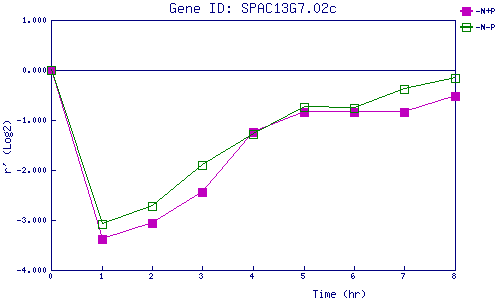
| -N+P | 0.000 | -3.383 | -3.063 | -2.445 | -1.247 | -0.839 | -0.841 | -0.830 | -0.528 |
| -N-P | 0.000 | -3.089 | -2.721 | -1.898 | -1.271 | -0.745 | -0.754 | -0.377 | -0.152 |
|
-N+P: Nitrogen starved in the presence of P-factor -N-P: Nitrogen starved in the absence of P-factor |