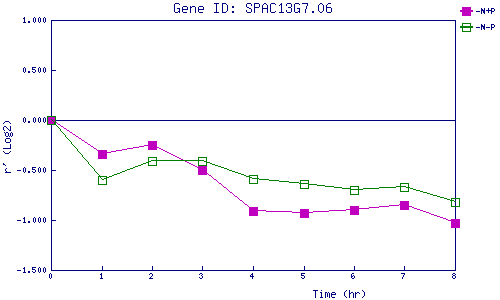
| 0 | 1 | 2 | 3 | 4 | 5 | 6 | 7 | 8 | |
| -N+P | 0.000 | -0.345 | -0.246 | -0.503 | -0.906 | -0.933 | -0.896 | -0.851 | -1.026 |
| -N-P | 0.000 | -0.595 | -0.409 | -0.406 | -0.590 | -0.637 | -0.700 | -0.668 | -0.816 |
|
-N+P: Nitrogen starved in the presence of P-factor -N-P: Nitrogen starved in the absence of P-factor |