crb3
| 0 | 1 | 2 | 3 | 4 | 5 | 6 | 7 | 8 | |
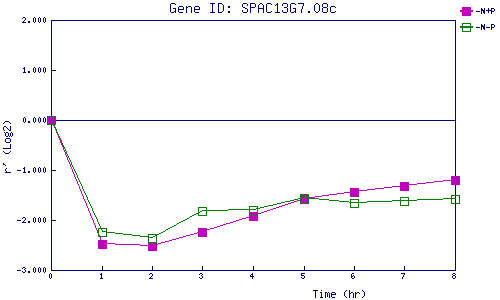
| -N+P | 0.000 | -2.490 | -2.512 | -2.243 | -1.913 | -1.584 | -1.445 | -1.320 | -1.190 |
| -N-P | 0.000 | -2.232 | -2.357 | -1.822 | -1.810 | -1.550 | -1.653 | -1.615 | -1.576 |
|
-N+P: Nitrogen starved in the presence of P-factor -N-P: Nitrogen starved in the absence of P-factor |
