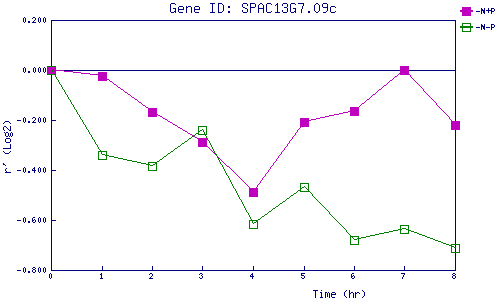
| 0 | 1 | 2 | 3 | 4 | 5 | 6 | 7 | 8 | |
| -N+P | 0.000 | -0.024 | -0.169 | -0.289 | -0.489 | -0.206 | -0.164 | -0.001 | -0.221 |
| -N-P | 0.000 | -0.339 | -0.384 | -0.240 | -0.618 | -0.468 | -0.680 | -0.636 | -0.711 |
|
-N+P: Nitrogen starved in the presence of P-factor -N-P: Nitrogen starved in the absence of P-factor |