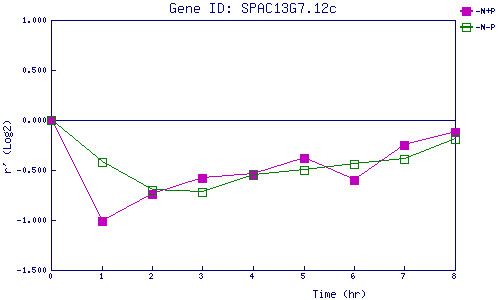
| 0 | 1 | 2 | 3 | 4 | 5 | 6 | 7 | 8 | |
| -N+P | 0.000 | -1.011 | -0.744 | -0.584 | -0.537 | -0.375 | -0.602 | -0.247 | -0.122 |
| -N-P | 0.000 | -0.419 | -0.698 | -0.718 | -0.551 | -0.496 | -0.437 | -0.391 | -0.191 |
|
-N+P: Nitrogen starved in the presence of P-factor -N-P: Nitrogen starved in the absence of P-factor |