gar2
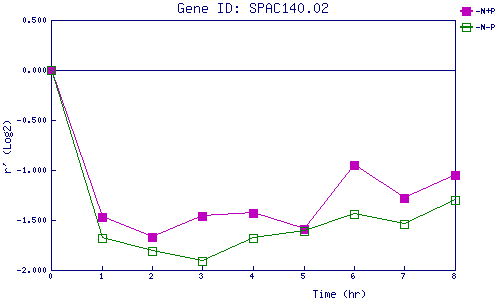
| 0 | 1 | 2 | 3 | 4 | 5 | 6 | 7 | 8 | |
| -N+P | 0.000 | -1.466 | -1.673 | -1.461 | -1.427 | -1.590 | -0.949 | -1.275 | -1.053 |
| -N-P | 0.000 | -1.681 | -1.810 | -1.910 | -1.680 | -1.611 | -1.445 | -1.544 | -1.301 |
|
-N+P: Nitrogen starved in the presence of P-factor -N-P: Nitrogen starved in the absence of P-factor |