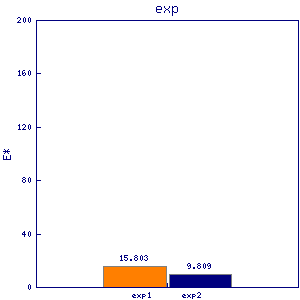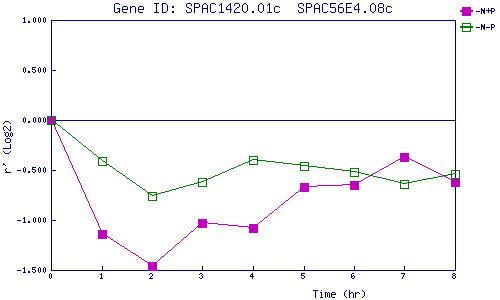
| 0 | 1 | 2 | 3 | 4 | 5 | 6 | 7 | 8 | |
| -N+P | 0.000 | -1.140 | -1.458 | -1.034 | -1.077 | -0.667 | -0.652 | -0.374 | -0.619 |
| -N-P | 0.000 | -0.410 | -0.755 | -0.619 | -0.405 | -0.455 | -0.520 | -0.638 | -0.535 |
|
-N+P: Nitrogen starved in the presence of P-factor -N-P: Nitrogen starved in the absence of P-factor |