cct5
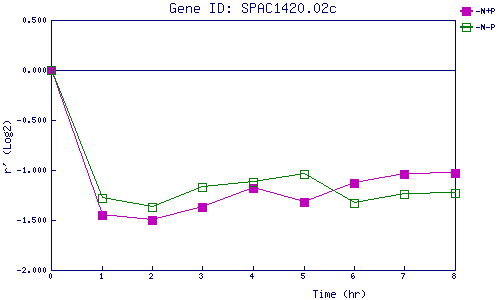
| 0 | 1 | 2 | 3 | 4 | 5 | 6 | 7 | 8 | |
| -N+P | 0.000 | -1.452 | -1.502 | -1.369 | -1.178 | -1.315 | -1.129 | -1.038 | -1.028 |
| -N-P | 0.000 | -1.276 | -1.371 | -1.171 | -1.118 | -1.043 | -1.332 | -1.244 | -1.227 |
|
-N+P: Nitrogen starved in the presence of P-factor -N-P: Nitrogen starved in the absence of P-factor |