rpn501 rpn5-a
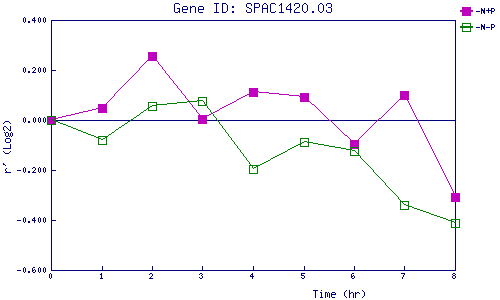
| 0 | 1 | 2 | 3 | 4 | 5 | 6 | 7 | 8 | |
| -N+P | 0.000 | 0.047 | 0.255 | 0.005 | 0.110 | 0.092 | -0.095 | 0.101 | -0.309 |
| -N-P | 0.000 | -0.078 | 0.055 | 0.076 | -0.197 | -0.088 | -0.125 | -0.340 | -0.411 |
|
-N+P: Nitrogen starved in the presence of P-factor -N-P: Nitrogen starved in the absence of P-factor |