| 0 | 1 | 2 | 3 | 4 | 5 | 6 | 7 | 8 | |
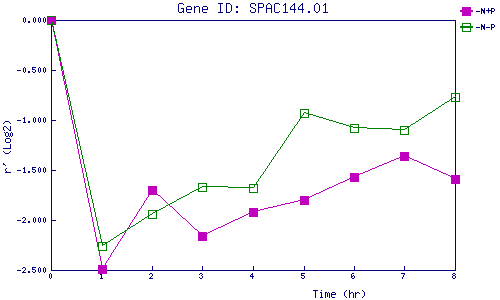
| -N+P | 0.000 | -2.489 | -1.697 | -2.155 | -1.923 | -1.796 | -1.570 | -1.360 | -1.587 |
| -N-P | 0.000 | -2.265 | -1.936 | -1.671 | -1.679 | -0.929 | -1.080 | -1.104 | -0.774 |
|
-N+P: Nitrogen starved in the presence of P-factor -N-P: Nitrogen starved in the absence of P-factor |