ade2 min10 min3
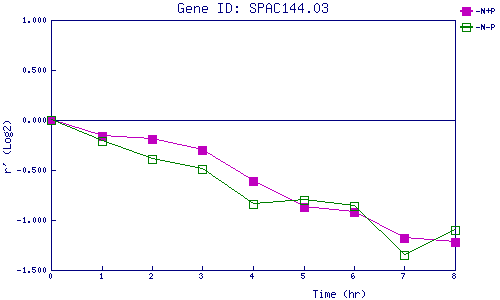
| 0 | 1 | 2 | 3 | 4 | 5 | 6 | 7 | 8 | |
| -N+P | 0.000 | -0.159 | -0.189 | -0.296 | -0.613 | -0.870 | -0.919 | -1.180 | -1.218 |
| -N-P | 0.000 | -0.206 | -0.394 | -0.486 | -0.841 | -0.798 | -0.862 | -1.354 | -1.102 |
|
-N+P: Nitrogen starved in the presence of P-factor -N-P: Nitrogen starved in the absence of P-factor |