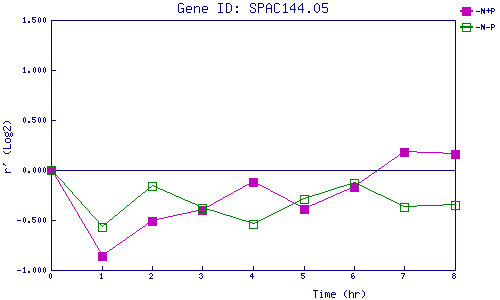
| 0 | 1 | 2 | 3 | 4 | 5 | 6 | 7 | 8 | |
| -N+P | 0.000 | -0.858 | -0.509 | -0.396 | -0.121 | -0.394 | -0.168 | 0.185 | 0.164 |
| -N-P | 0.000 | -0.574 | -0.164 | -0.377 | -0.536 | -0.286 | -0.129 | -0.373 | -0.352 |
|
-N+P: Nitrogen starved in the presence of P-factor -N-P: Nitrogen starved in the absence of P-factor |