apl5
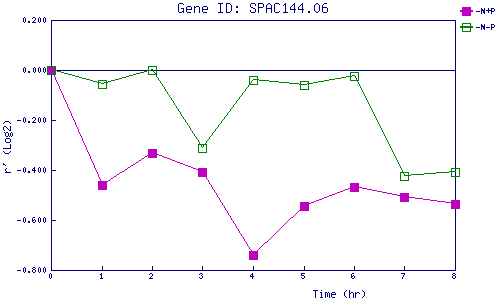
| 0 | 1 | 2 | 3 | 4 | 5 | 6 | 7 | 8 | |
| -N+P | 0.000 | -0.459 | -0.332 | -0.407 | -0.739 | -0.542 | -0.469 | -0.509 | -0.538 |
| -N-P | 0.000 | -0.055 | 0.002 | -0.313 | -0.042 | -0.060 | -0.026 | -0.426 | -0.409 |
|
-N+P: Nitrogen starved in the presence of P-factor -N-P: Nitrogen starved in the absence of P-factor |