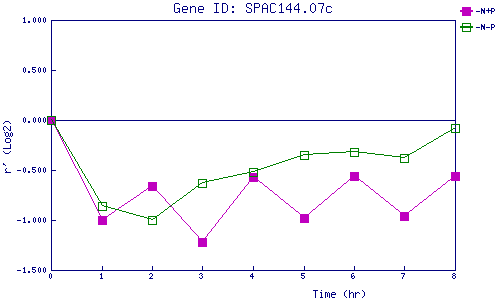
| 0 | 1 | 2 | 3 | 4 | 5 | 6 | 7 | 8 | |
| -N+P | 0.000 | -0.998 | -0.658 | -1.223 | -0.573 | -0.981 | -0.562 | -0.964 | -0.564 |
| -N-P | 0.000 | -0.858 | -1.004 | -0.630 | -0.525 | -0.348 | -0.319 | -0.385 | -0.084 |
|
-N+P: Nitrogen starved in the presence of P-factor -N-P: Nitrogen starved in the absence of P-factor |