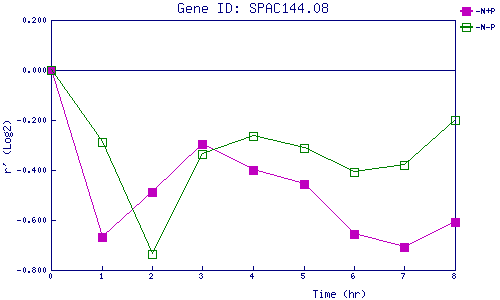
| 0 | 1 | 2 | 3 | 4 | 5 | 6 | 7 | 8 | |
| -N+P | 0.000 | -0.669 | -0.486 | -0.297 | -0.400 | -0.456 | -0.658 | -0.708 | -0.608 |
| -N-P | 0.000 | -0.287 | -0.736 | -0.335 | -0.265 | -0.313 | -0.410 | -0.379 | -0.199 |
|
-N+P: Nitrogen starved in the presence of P-factor -N-P: Nitrogen starved in the absence of P-factor |