sfc2
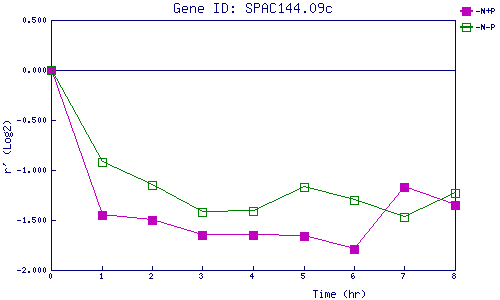
| 0 | 1 | 2 | 3 | 4 | 5 | 6 | 7 | 8 | |
| -N+P | 0.000 | -1.451 | -1.502 | -1.647 | -1.651 | -1.655 | -1.789 | -1.166 | -1.350 |
| -N-P | 0.000 | -0.920 | -1.149 | -1.420 | -1.412 | -1.166 | -1.303 | -1.471 | -1.226 |
|
-N+P: Nitrogen starved in the presence of P-factor -N-P: Nitrogen starved in the absence of P-factor |