gwt1
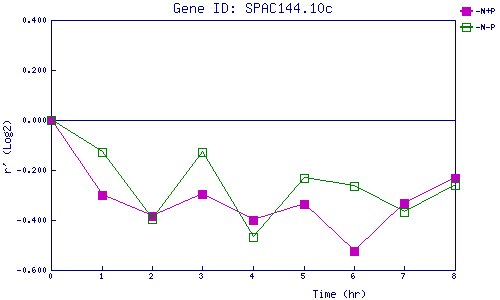
| 0 | 1 | 2 | 3 | 4 | 5 | 6 | 7 | 8 | |
| -N+P | 0.000 | -0.301 | -0.382 | -0.297 | -0.400 | -0.337 | -0.525 | -0.333 | -0.234 |
| -N-P | 0.000 | -0.127 | -0.397 | -0.130 | -0.469 | -0.232 | -0.265 | -0.368 | -0.260 |
|
-N+P: Nitrogen starved in the presence of P-factor -N-P: Nitrogen starved in the absence of P-factor |