rps11-2 rps1102 rps11
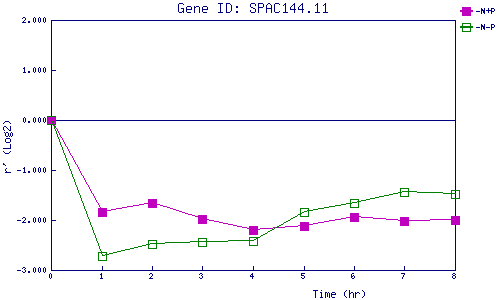
| 0 | 1 | 2 | 3 | 4 | 5 | 6 | 7 | 8 | |
| -N+P | 0.000 | -1.847 | -1.666 | -1.971 | -2.193 | -2.126 | -1.936 | -2.029 | -1.993 |
| -N-P | 0.000 | -2.721 | -2.471 | -2.449 | -2.411 | -1.847 | -1.665 | -1.449 | -1.475 |
|
-N+P: Nitrogen starved in the presence of P-factor -N-P: Nitrogen starved in the absence of P-factor |