| 0 | 1 | 2 | 3 | 4 | 5 | 6 | 7 | 8 | |
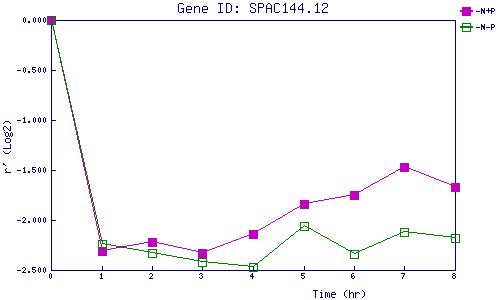
| -N+P | 0.000 | -2.306 | -2.220 | -2.328 | -2.140 | -1.841 | -1.753 | -1.469 | -1.669 |
| -N-P | 0.000 | -2.245 | -2.329 | -2.424 | -2.466 | -2.062 | -2.340 | -2.118 | -2.178 |
|
-N+P: Nitrogen starved in the presence of P-factor -N-P: Nitrogen starved in the absence of P-factor |