prl14
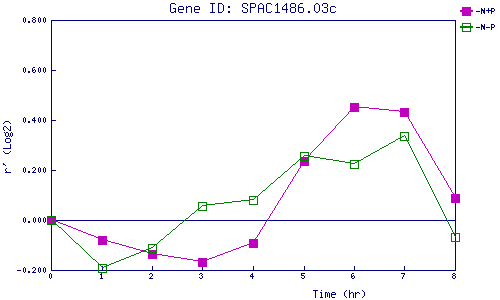
| 0 | 1 | 2 | 3 | 4 | 5 | 6 | 7 | 8 | |
| -N+P | 0.000 | -0.080 | -0.135 | -0.168 | -0.091 | 0.236 | 0.452 | 0.430 | 0.086 |
| -N-P | 0.000 | -0.191 | -0.113 | 0.054 | 0.082 | 0.255 | 0.225 | 0.337 | -0.068 |
|
-N+P: Nitrogen starved in the presence of P-factor -N-P: Nitrogen starved in the absence of P-factor |