alm1
| 0 | 1 | 2 | 3 | 4 | 5 | 6 | 7 | 8 | |
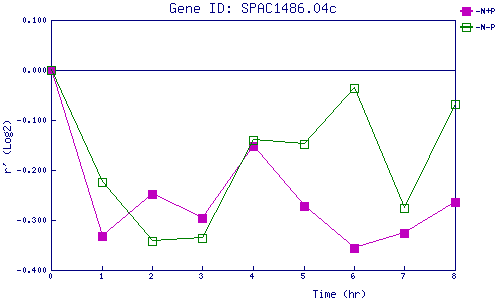
| -N+P | 0.000 | -0.331 | -0.247 | -0.297 | -0.152 | -0.272 | -0.356 | -0.326 | -0.264 |
| -N-P | 0.000 | -0.224 | -0.342 | -0.336 | -0.141 | -0.147 | -0.035 | -0.277 | -0.067 |
|
-N+P: Nitrogen starved in the presence of P-factor -N-P: Nitrogen starved in the absence of P-factor |
