reserved_name_nup189
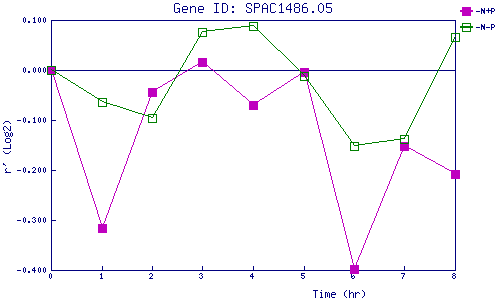
| 0 | 1 | 2 | 3 | 4 | 5 | 6 | 7 | 8 | |
| -N+P | 0.000 | -0.316 | -0.045 | 0.017 | -0.070 | -0.004 | -0.398 | -0.152 | -0.207 |
| -N-P | 0.000 | -0.064 | -0.095 | 0.076 | 0.087 | -0.013 | -0.151 | -0.138 | 0.066 |
|
-N+P: Nitrogen starved in the presence of P-factor -N-P: Nitrogen starved in the absence of P-factor |