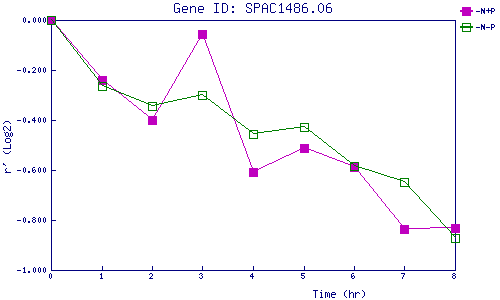
| 0 | 1 | 2 | 3 | 4 | 5 | 6 | 7 | 8 | |
| -N+P | 0.000 | -0.241 | -0.399 | -0.058 | -0.608 | -0.511 | -0.587 | -0.837 | -0.830 |
| -N-P | 0.000 | -0.264 | -0.345 | -0.300 | -0.457 | -0.427 | -0.583 | -0.649 | -0.874 |
|
-N+P: Nitrogen starved in the presence of P-factor -N-P: Nitrogen starved in the absence of P-factor |