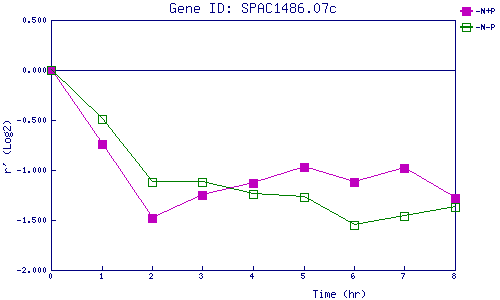
| 0 | 1 | 2 | 3 | 4 | 5 | 6 | 7 | 8 | |
| -N+P | 0.000 | -0.745 | -1.484 | -1.249 | -1.130 | -0.968 | -1.125 | -0.982 | -1.280 |
| -N-P | 0.000 | -0.494 | -1.115 | -1.117 | -1.240 | -1.271 | -1.553 | -1.458 | -1.367 |
|
-N+P: Nitrogen starved in the presence of P-factor -N-P: Nitrogen starved in the absence of P-factor |